The diagram shows the change of phases of a substance on a temperature vs time graph
Heat (10)The diagram below shows the change of phases of a substance on a temperature vs time graph on heating the substance at a constant rate.
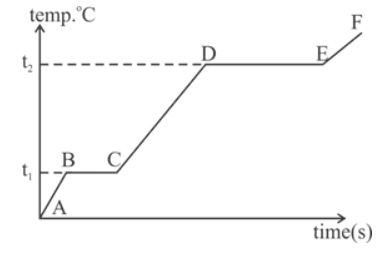
- Why is the slope of CD less than slope of AB?
- What is the boiling and melting point of the substance?
Answer
(i) Specific heat capacity in liquid state is greater than specific heat capacity in solid state
(ii) Boiling point t2 oC
Melting point t1oC
- Exam Year: 2020